
This research paper explores the analysis of network traffic on a home Wi-Fi network specifically related to Loco.gg, a free online gaming platform that allows gamers to showcase their skills globally. Historically, hard-core gaming was limited, but with technological advancements in smartphones and affordable mobile internet access, games like PUBG Mobile and Free Fire gained widespread popularity. Loco emerged as a platform catering to this growing interest in hard-core gaming. The primary focus of this study was to conduct a thorough analysis of Loco's high-definition live streaming feature, examining network performance metrics such as bandwidth usage, round trip time, packet loss rates, and employed protocols. To achieve this, both the voice and video of players, as well as the audio and visual aspects of the game, were simultaneously observed on the Loco site. Network traffic data was captured using the Wireshark packet analyzer, providing raw data for further investigation. As live streaming is continuously available on the site, data collection occurred at various times throughout the day. The captured network data was then consolidated and analyzed using Wireshark to extract statistical insights, presenting information on overall bandwidth consumption and the predominant protocols used. The results revealed that while both TCP and UDP protocols were utilized, UDP was more extensively employed within the loco.gg network architecture. This research contributes valuable insights to the understanding of modern online gaming platforms and their interactions with internet networks. By offering a detailed examination of live streaming functionality and associated performance characteristics of loco.gg, the paper provides essential information for both gaming enthusiasts and industry professionals seeking a nuanced perspective on the intricacies of high-definition content delivery and the mechanisms powering gameplay experiences in a networked environment.
INTRODUCTION
The internet serves as a global network connecting computers and networks worldwide, enabling the seamless exchange of information through various protocols, notably TCP/IP. Among the platforms, harnessing the internet is Loco, a live streaming service founded in 2017 by Anirudh Pandita and Ashwin Suresh. Loco has experienced significant growth, boasting 60 million registered users and surpassing market leader Twitch in daily active users' share. Operating predominantly at the Application Layer (Layer 7) of the OSI model, Loco Stream Live utilizes protocols like HTTP and Web Sockets for data transmission. Wireshark, an advanced network protocol analyzer, plays a crucial role in dissecting the complexities of Loco's live streaming functionalities, offering insights into throughput, bandwidth, and packet loss. Wireshark's examination of data packets at the Application Layer unveils the connection dynamics between the Loco server and client devices. This analysis aids in assessing the efficiency of streaming protocols, optimizing performance, and addressing potential issues in real-time chat features. Loco Stream Live's commitment to delivering high-quality content is a standout feature, and Wireshark proves instrumental in evaluating factors affecting video quality, including bitrates, resolution, and frame rates. It also helps identify and resolve TCP-related issues, ensuring a smooth streaming experience by mitigating buffering and latency.
Online gaming, a global phenomenon, faces cybersecurity threats like phishing and DDoS attacks. Loco.gg, a leading game streaming platform, recently experienced deceptive tactics, emphasizing the need for enhanced security measures. Bandwidth, latency, ping rates, and packet loss are crucial factors influencing the gaming experience. Lower ping rates contribute to faster responsiveness, while packet loss thresholds are identified to prevent disruptions. Wireshark's real-time traffic capture and flexible filtering enable in-depth analysis, revealing insights into Loco's network behaviour and contributing to the identification of a traffic model.
Wireshark's role in network protocol analysis underscores its significance in optimizing gaming experiences on platforms like Loco. When users with varying Wi-Fi speeds access online streaming platforms, factors come into play regarding packet length, protocol types, and destination/source IP addresses. Packet length is influenced by network technology (Ethernet, Wi-Fi) and Maximum Transmission Unit (MTU) settings. In scenarios with different Wi-Fi speeds, packet length may adjust to accommodate varying bandwidths. For instance, User A (50 Mbps) might receive larger packets than User B (10 Mbps) due to higher available bandwidth. Online streaming portals commonly use protocols like HTTP, HTTPS, RTMP (Real-time Messaging Protocol), or HLS (HTTP Live Streaming). The chosen protocol affects data transfer efficiency and adaptation to changing network conditions. Destination and Source IP Addresses play a crucial role. The destination IP address points to the server hosting the streaming content, while the source IP address identifies the user's device. Analyzing these addresses is crucial for understanding data flow between users and servers. Wireshark's insights into packet lengths, protocol types, and IP addresses become invaluable as Wi-Fi speeds differ. This information aids researchers in unravelling network traffic complexities, contributing to the enhancement of gaming network performance. In the evolving landscape of online gaming platforms, Wireshark remains an indispensable tool for optimizing the gaming experience for users and developers alike.
In scenarios involving different Wi-Fi speeds, the user's device is assigned a local IP address by the router (e.g., 192.168.x.x), while the streaming server or CDN has a public IP address. The dynamic interplay between these source and destination IP addresses dictates packet routing through routers and switches in the network infrastructure. This highlights the nuanced relationship between local and public IP addresses, influencing the efficiency of data transmission and the overall streaming experience.
LITERATURE REVIEW
A. Loco
Loco is a live game streaming platform that allows users to broadcast and watch gaming sessions. It offers a social gaming community where users can interact, share content, and participate in live chats while watching streams. Loco supports various gaming genres and provides features like live commentary, screen sharing, and monetization options for streamers. Its user-friendly interface and engagement tools make it popular among gamers seeking live gaming content.
B. Wireshark
Wireshark is a widely used network protocol analyzer that captures and displays data packets on a network in real-time. It enables users to inspect network traffic, analyze protocols, and troubleshoot network issues. Wireshark supports various protocols, providing detailed information about packet headers, payloads, source and destination addresses, and timestamps. Its powerful filtering capabilities allow users to focus on specific packets and dissect network behaviour, making it an essential tool for network administrators, security analysts, and developers.
C. Protocols (TCP, UDP, QUIC)
TCP is a connection-oriented protocol in the TCP/IP suite. It ensures reliable and ordered delivery of data between devices over a network. TCP establishes a connection, breaks data into segments, numbers them for sequencing, and manages flow control to avoid congestion. It provides error checking and acknowledgment mechanisms for reliable data transmission, making it suitable for applications requiring accuracy, such as web browsing, file transfers, and email communication.
UDP is a connectionless protocol in the TCP/IP suite that provides a lightweight and fast data transmission method. Unlike TCP, UDP does not guarantee reliable delivery or order of data packets. It sends data as datagrams without establishing connections, making it faster but less reliable. UDP is used in applications like online gaming, video streaming, DNS, and VoIP, where real-time data transmission and speed are prioritized over reliability.
QUIC is a modern transport protocol developed by Google that operates over UDP. It aims to improve web performance by reducing latency and enhancing security compared to traditional protocols like TCP. QUIC integrates features like encryption, multiplexing, and error correction into a single protocol, enabling faster connection establishment and efficient data transmission. It is designed to optimize web browsing, streaming, and mobile applications by minimizing connection setup times and improving reliability. See Figure 1.
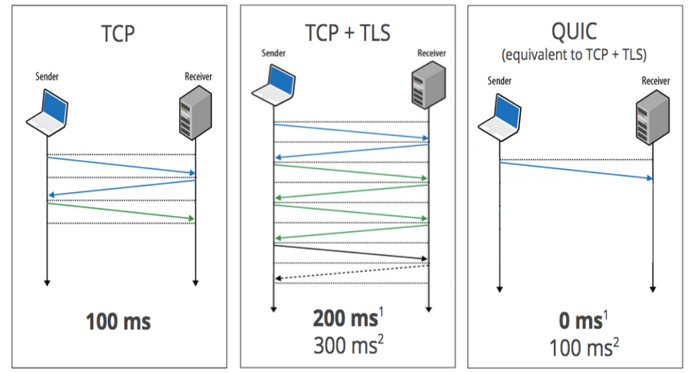
Figure. 1. Zero RTT Connection Establishment
D. IP Addresses
IP (Internet Protocol) addresses are unique numerical identifiers assigned to devices connected to a network. They facilitate communication and routing of data across the internet. There are two main versions of IP addresses: IPv4 (32-bit) and IPv6 (128-bit). IPv4 addresses are in the form of four decimal numbers separated by periods (e.g., 192.168.0.1), while IPv6 addresses use hexadecimal characters separated by colons (e.g., 2001:0db8:85a3:0000:0000:8a2e:0370:7334). IP addresses serve as both source and destination addresses for data packets, allowing routers to forward packets to the correct destination. They are fundamental to the functioning of the internet and are allocated hierarchically to devices to enable global connectivity. See Figure 2.
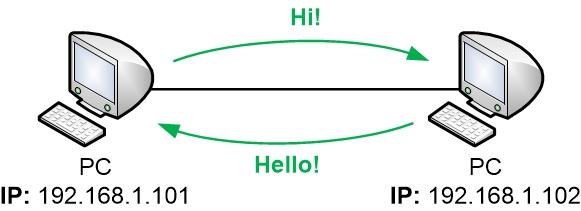
Figure. 2. Source and Destination IP Addresses
METHODOLOGY
A. Data Collection
For the analysis of Loco.gg's network, Wireshark was employed from 09.11.2023 to 03.12.2023. The data collection period aimed to encompass diverse scenarios, including peak gaming hours and special events, offering a comprehensive view of network traffic dynamics.
Wireshark, serving as a key tool, was not merely a passive observer; it was configured to capture a broad spectrum of packets. Alongside packet data, essential metadata such as timestamps, packet sizes, and source/destination IP addresses were logged. This information acted as a magnifying glass, facilitating pattern identification, timing analysis, and the identification of major network players.
Adherence to privacy rules and platform integrity was paramount throughout the data collection process, ensuring no compromise of users' personal information. Challenges, including packet loss, were encountered and addressed through the refinement of Wireshark filters to enhance accuracy. See Figure 3.
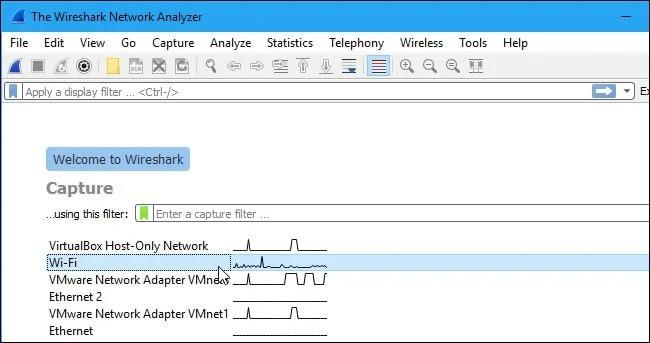
Figure. 3. Data Collection with Wi-Fi
B. Data Filtering
Following the successful collection of network data using Wireshark, a methodical data filtering process was executed. The primary objective at this stage was to meticulously refine the dataset, focusing on specific elements crucial to the investigation of Loco.gg's network dynamics. Recognizing the inherent diversity within network traffic, a targeted approach was adopted to select and prioritize specific packet types. Particular emphasis was placed on critical components, notably video streaming packets and chat interactions, representing the fundamental functionalities of the Loco.gg platform.
Data filtering unfolded as an iterative and dynamic process, requiring ongoing refinement to ensure precision. Challenges, including packet loss, were systematically addressed through a continuous enhancement of filters. This iterative approach aimed to elevate the accuracy and reliability of the resulting filtered dataset. Every filtering criterion was thoughtfully aligned with the overarching research questions. Whether delving into investigations of peak gaming periods or assessing the impact of specific protocols, each filter was intentionally crafted to serve as a precise means of extracting data that significantly contributed to addressing the core research inquiries.
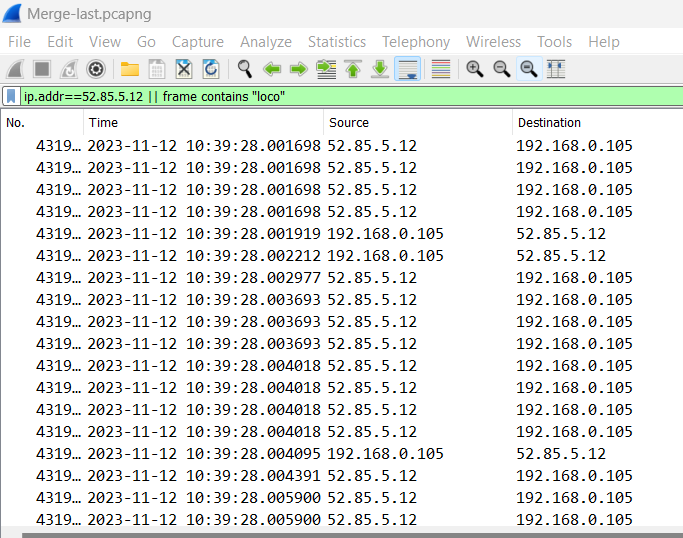
Figure. 4. Filtering Data with Wireshark
RESULTS
A. Bandwidth Analysis
Analyzing bandwidth is crucial for businesses managing large enterprise networks, and it plays a significant role in ensuring optimal operations and user experience. Bandwidth, in the context of computer networking, refers to the maximum data transfer rate and capacity of a network connection. It is measured in bits per second and represents the amount of data that can be transmitted over a network within a given time period. In the case of Loco, a live streaming platform, bandwidth is particularly important for delivering a seamless and high-quality user experience. Loco Stream Live relies heavily on efficient data transmission to support live streaming functionalities, including video streaming, real-time chat, and interactive elements that enhance user engagement. Bandwidth determines how quickly data, such as video content, can be transferred between the Loco server and the client devices of users.
Bandwidth utilization in the context of Loco would involve measuring the percentage of available network bandwidth that is currently being used during live streaming sessions. This is crucial for assessing how efficiently the network's capacity is utilized at any given moment. For Loco, download speeds are essential for users to receive the streaming content smoothly, and upload speeds are crucial for creators who are broadcasting their content. Analyzing bandwidth helps ensure that both download and upload speeds are sufficient for delivering high-quality streaming experiences. Bandwidth analysis with tools like Wireshark allows for a closer examination of factors such as latency and packet loss. In the context of Loco, low latency is critical for real-time interactions in live chat, while minimizing packet loss is vital for maintaining the quality of the streaming content. Wireshark's network performance monitoring capabilities can be applied to Loco to identify and address potential issues, optimize streaming protocols, and enhance the overall performance of the live streaming platform. See Figure 5.
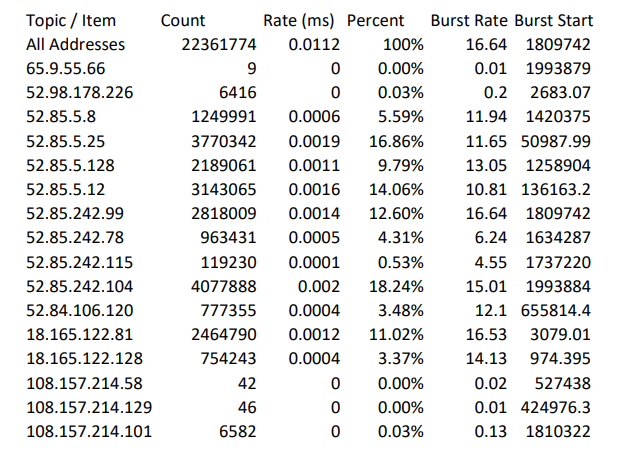
Figure. 5. Bandwidth of data
We present a bandwidth graph based on the data we collected as shown above. The first row in our graph contains all the IP addresses of our data. Then there are packet counts corresponding to each IP address. We have a total of 22,361,774 packages. The rate of all of them is noted accordingly. As you can see, some IP addresses have many packets, while others have few packets. For packet counts below approximately 100,000, the rate is approximately zero. However, rates are adjusted regardless of the number of packages.
B. Comparing the 10th day graph and the last day graph
In the process of creating an optimal network, the analysis results of the user's internet usage are much needed. Because data analysis results can be used to evaluate the design of a network system, that better suits user requirements in managing bandwidth. Here we analyzed internet usage traffic using Wireshark. These are used to sniff routers to receive packets from a network and filter HTTP packet data.
In this study, we conducted a study to analyze internet traffic usage for a month. We divided the graphs into days. The result of the graph displayed are the 10th day and the last day. The first day research was conducted on Thursday, November 9, 2023. In addition, the 10th day research was conducted on Saturday, November 18, 2023, with the highest access time at approximately 11:39. The most collected package at this time is 35,000. Additionally, when we look at the graph, we observe that the packages decreased until approximately 11:15. See Figure 6.
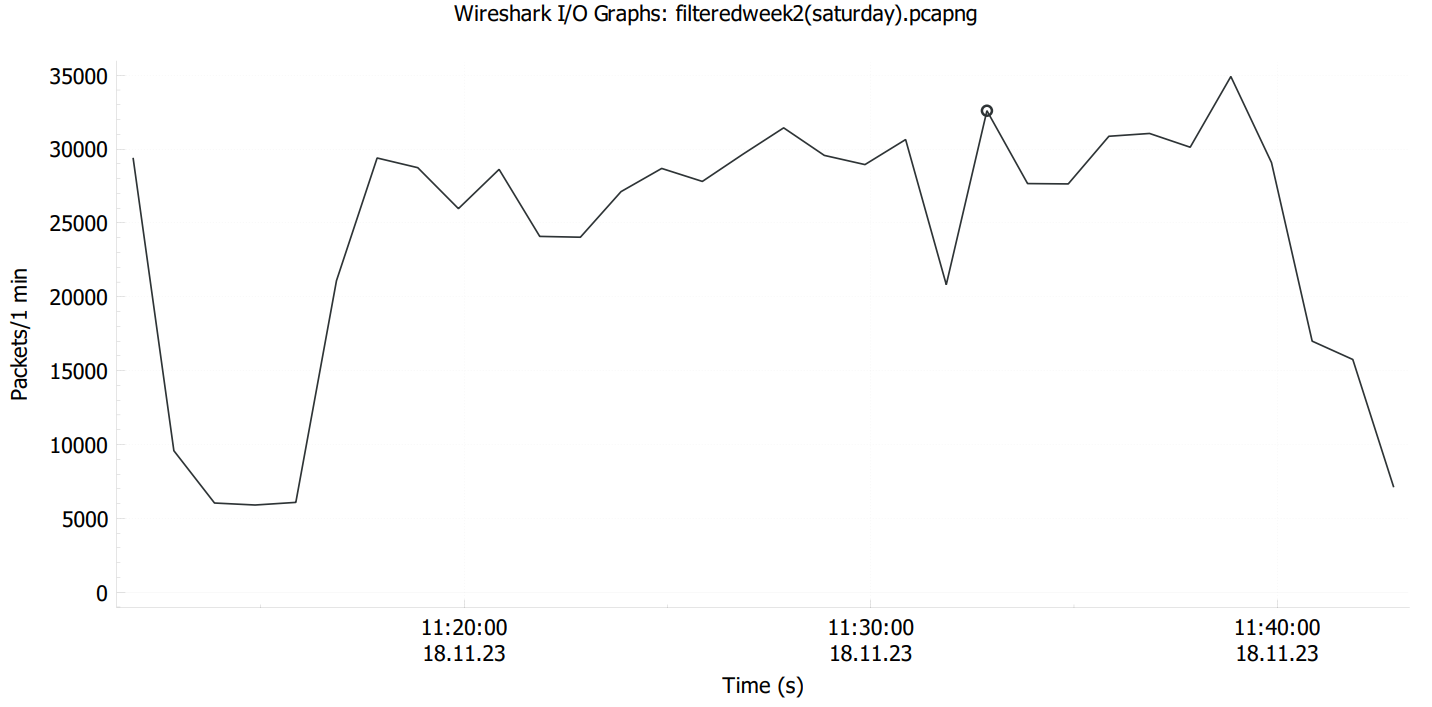
Figure. 6. The result graph of the 10th day.
Then we see the results of November 14, 19, 24 and 29, respectively. The last day of research was conducted on Wednesday, November 29, 2023. If we pay attention to the last day, we can see a graph that increases and changes from time to time towards the night. Compared to the 10th day graph, we can see that there is not a huge difference between the collected packages. Most packages were collected on November 14. This number exceeded 40,000. See Figure 7.
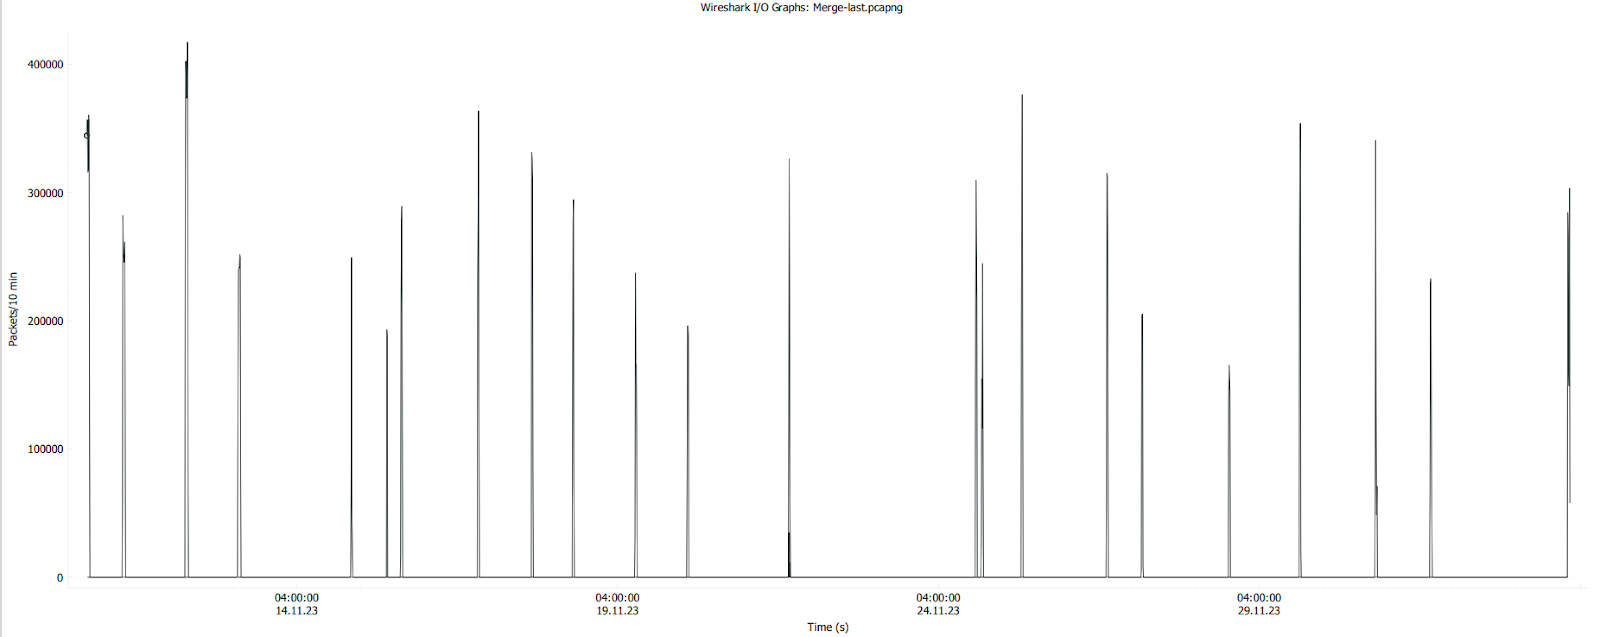
Figure. 7. Last Result Graph
C. Latency Analysis
The Loco streaming platform aims to deliver high-quality video contents to users in real-time. Latency is a critical factor in ensuring a seamless streaming experience. The analysis focuses on the round-trip time (RTT) in milliseconds (ms) and its relationship with time (s) during the streaming process. See Figure 8.
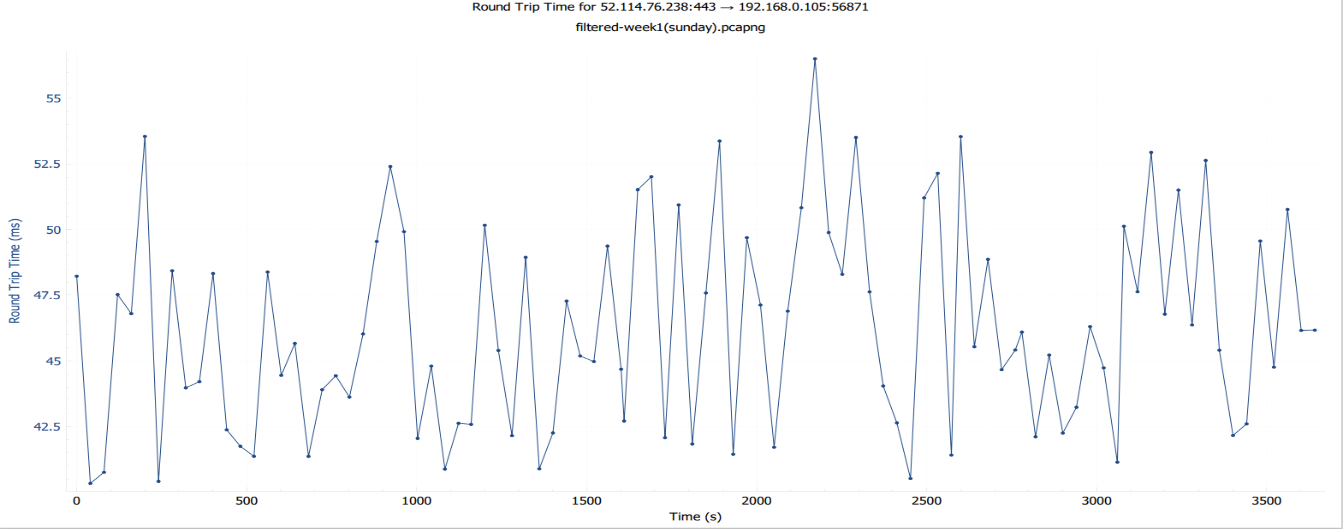
Figure. 8. Latency Analysis
The graph is segmented into various phases of the streaming process.
At the start of the streaming session, there is an initial space spike in latency as the client establishes a connection with the Loco server. RTT during this phase might range from 48.2ms to 53.6ms.
Following connection establishment, there is a brief buffering and initialization phase where latency remains relatively stable. For example, in our case RTT may change between 44ms to 44.6ms. Once buffering is complete, the system enters the steady-state streaming phase characterized by consistent RTT. In the event of network congestion or fluctuations, there may be intermittent increase in RTT. When the streaming platform adjusts video quality based on available bandwidth, there might be brief spikes in latency as the adaptation occurs.
In conclusion we can say that the latency analysis of the Loco streaming platform reveals a well-optimized system with low and stable latency during the majority of the streaming process. Peaks in latency are primarily associated with initial connection establishment, network congestion and quality adaptation. See Figure 9.
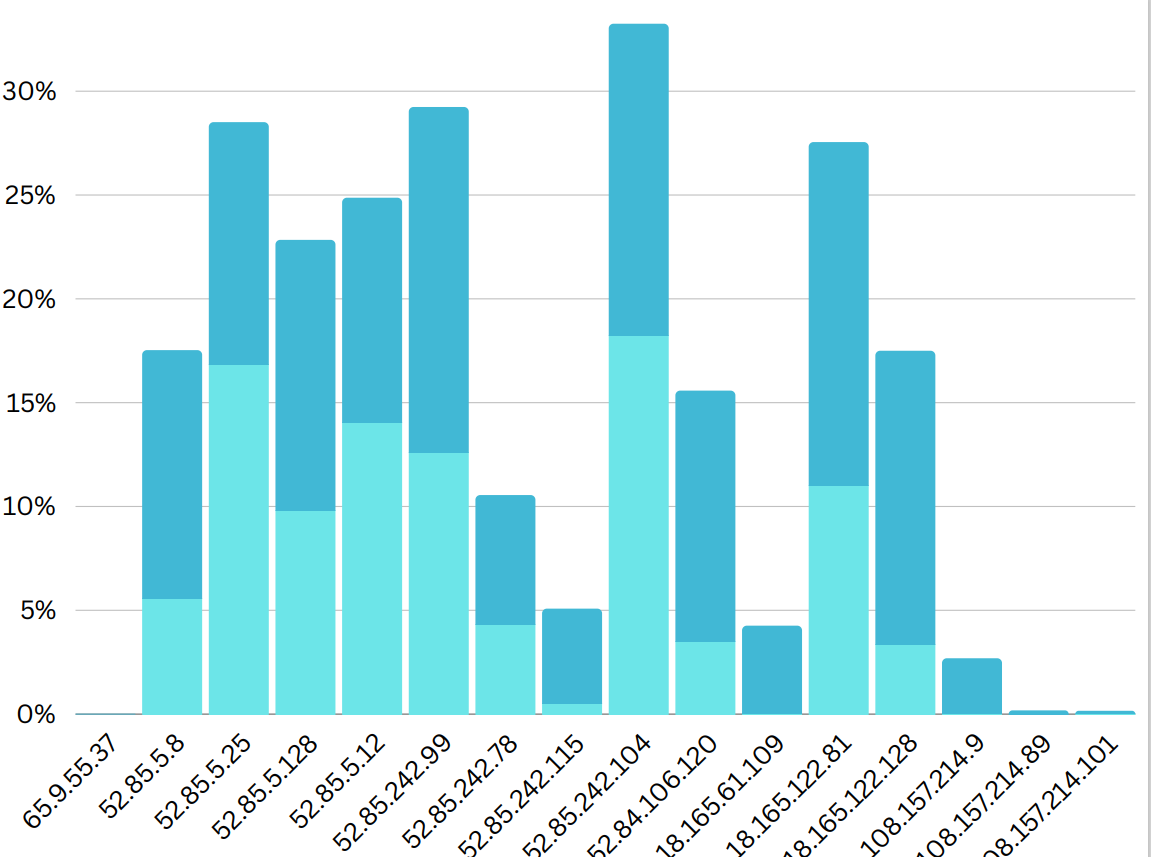
Figure. 9. IP Addresses
D. IP Addresses
The graph illustrates the distribution of IP addresses associated with the Loco streaming platform. Each IP address is accompanied by its respective percentage, reflecting the proportion of network traffic attributed to that particular address.
Top IP Addresses:
52.85.242.104(34%): This IP address stands out as the highest contributor, representing a significant portion of the network traffic. Investigating this address further may provide insights into its role and significance within the Loco streaming platform.
52.85.5.25(28%): Another notable IP address, accounting for a substantial portion of traffic.
52.85.5.128(23%): This IP address is a key player in the network, contributing significantly to the overall traffic. Exploring its connections and interactions will contribute to a more nuanced understanding of the Loco streaming platform.
Trends:
The changing percentages indicate that the network's activity is not constant; it fluctuates over time. By studying these variations, we can discover when the network experiences high usage, potential areas where it slows down (bottlenecks), or any unusual patterns that might indicate issues.
Certain IP addresses, such as 52.85.242.99 and 52.85.5.8, from clusters with higher percentages. Investigating these clusters may unveil specific functionalities, server roles or content delivery nodes within the Loco streaming infrastructure.
Source Addresses:
In networking, the source address refers to the origin of a network packet. It identifies the device or system that initiated the communication.
Analyzing source addresses in the Loco streaming platform can provide insights into the origins of data packets. Source addresses, like 65.9.55.37 and 108.157.214.9 may represent servers, user devices or other components contributing to the network traffic. Understanding the role of different sources helps in identifying the entities actively participating in data transmission.
Destination Addresses:
The destination addresses, such as 52.85.242.78 and 18.165.122.128 allow us to understand where the data is being sent within the Loco streaming platform. These addresses could represent servers, content delivery nodes or specific services. Analyzing destination addresses helps unveil the distribution of content or services, providing a map of how information flows within the network.
E. Flow Analysis
The flow graph illustrates the communication patterns within the Loco streaming platform. The graph includes time intervals, six IP addresses and a comment section on the left detailing specific UDP flows. See Figure 10.
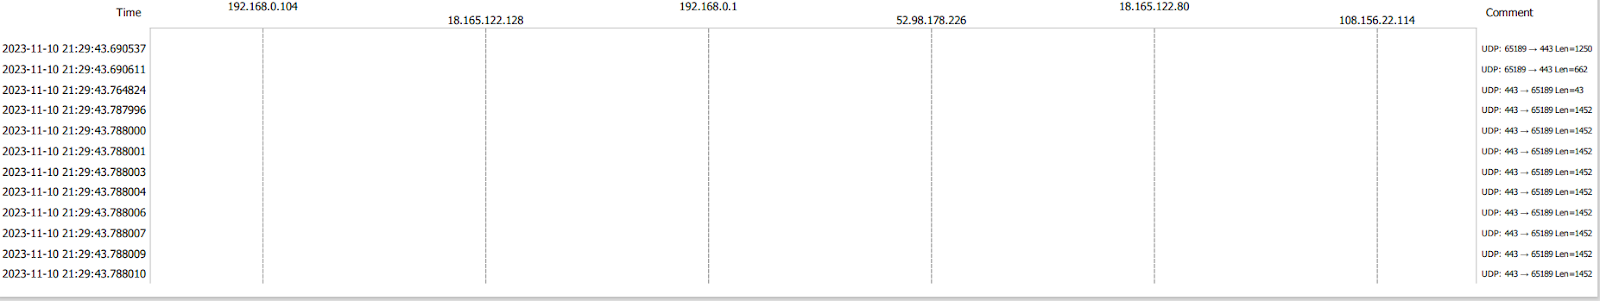
Figure. 10. Flow Analysis
The graph depicts a series of time intervals, revealing the temporal dynamics of communication events. Notable events occur at specific timestamps, aiding in the identification of patterns or irregularities. IP Address Interactions: Six IP addresses along the upper line represent unique entities engaged in communication. The relationships between these IP addresses offer insights into the network topology and potential communication pathways.
UDP flows are characterized by source and destination IP addresses, ports and payload lengths. Varied payload lengths suggest diverse data transmission requirements for different flows.
F. TCP, UDP and QUIC Protocols
If a significant portion of Loco's traffic is carried over UDP and QUIC, it suggests that the platform is likely focused on real-time content delivery and interactive communication. UDP (User Datagram Protocol) and QUIC (Quick UDP Internet Connections) are protocols that prioritize speed and efficiency over error-checking and reliable delivery. This makes them suitable for applications where timely transmission of data is more critical than ensuring every piece of data arrives intact. For example, live streaming and user interactions, such as chat messages or reactions during a live broadcast, benefit from the low-latency characteristics of UDP and the fast connection establishment of QUIC. These protocols are well suited for scenarios where immediate responsiveness is valued, even if it comes at the cost of potential data loss or out-of-order delivery.
On the other hand, TCP (Transmission Control Protocol), which is known for its reliable and ordered data delivery, is commonly used in scenarios where data integrity is paramount. This includes file transfers, where ensuring that every part of a file arrives intact and in the correct order is crucial. In essence, the dominance of UDP and QUIC in Loco's traffic indicates a design choice favouring real-time interactivity, responsiveness, and efficiency, while acknowledging the trade-off of potential data loss. The presence of TCP traffic, although a smaller percentage, may suggest that there are elements of the platform that require the reliability and ordered delivery characteristics provided by TCP, such as certain file transfers or more critical data exchanges. See Figure 11.
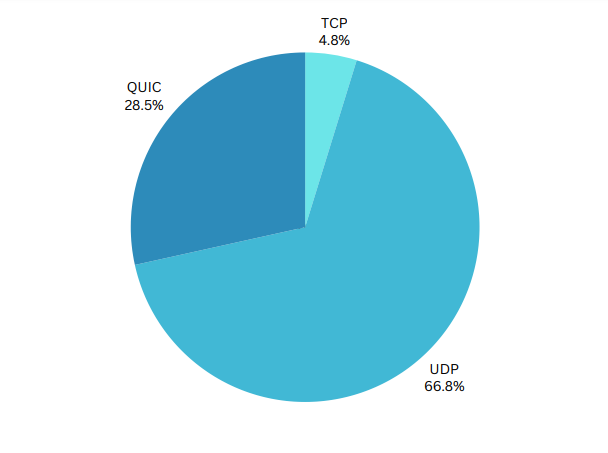
Figure. 11. Protocols
G. Throughput
Network throughput, often described as the "speed" of a network, is the actual rate of data delivery across a communication channel. Imagine it as the flow of messages, containing data, transmitted over physical or logical pathways within a network. This data flow is typically measured in bits per second (bps), though other units like packets per second (pps) are sometimes used. However, throughput goes beyond just speed. It is the sum of data rates delivered to all devices in a network, analogous to the total water flowing through multiple pipes. This is often referred to as "aggregate throughput" or "system throughput." Interestingly, throughput and digital bandwidth consumption are essentially synonymous. This means that quantifying throughput can be achieved through queuing theory, a mathematical approach to analyze waiting lines and delays in systems. Various factors, including the inherent limitations of the physical medium (e.g., cables), processing capabilities of network components, and even end-user behaviour, can significantly impact actual throughput. This is where good put comes into play. It represents the true, usable data transfer rate, obtained by accounting for protocol overheads and various inefficiencies. In essence, it reflects the "real world" speed experienced by users. Understanding throughput and its nuances is crucial for optimizing network performance and delivering a smooth user experience. Throughput Analysis delves into the dynamic relationship between a system's inputs, constraints, configuration, and its output rate. This analytical method seeks to uncover the intricate interplay between these factors, ultimately aiming to optimize performance and maximize output. Its close association with the Theory of Constraints further emphasizes the crucial role of bottleneck identification and management in achieving peak performance. By pinpointing and addressing these bottlenecks, Throughput Analysis empowers us to unlock the full potential of any system. See Figure 12.
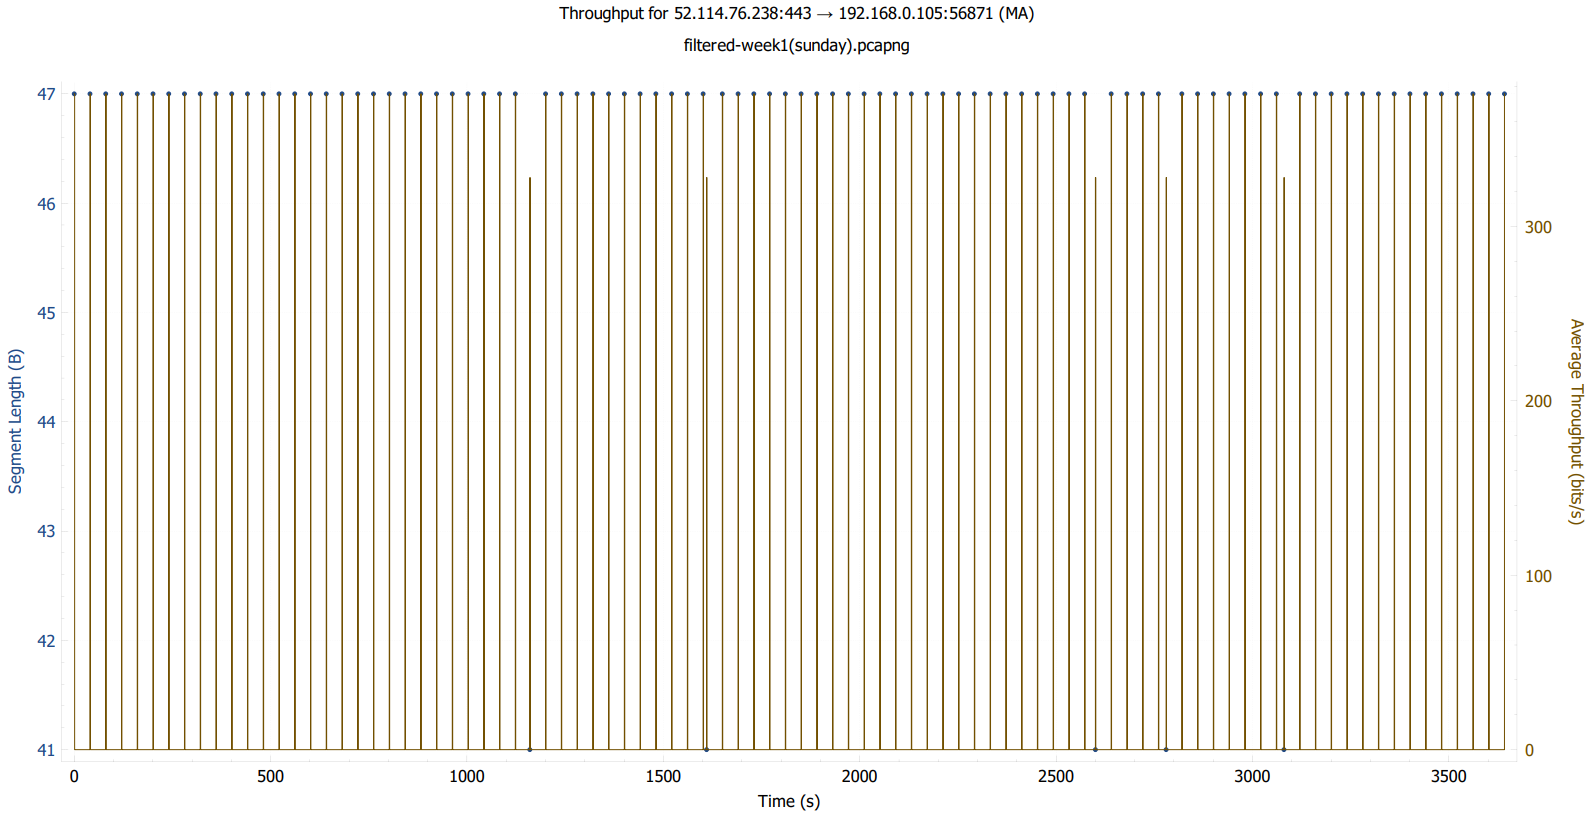
Figure. 12. bps of Wireshark
It can be seen in Figure 11, that Wireshark does not have a large range of throughput and is not changing swiftly. It shows a constant behaviour. Swift changes and high cut-offs indicate a bad tendency of the network. Constant Throughput: The data suggests that Wireshark captures a relatively constant throughput for the loco.gg website. This indicates stable data transfer without significant spikes or dips, which is generally considered positive for network performance. Limited Range: The statement mentions that Wireshark does not have a large range of throughput. This could imply several possibilities: Stable Connection: A limited range could indeed indicate a stable connection with minimal variation in data transfer rate, which is desirable for certain applications. Low Traffic: Alternatively, it could represent a low overall traffic volume for the loco.gg website, resulting in a narrow range of observed throughput values.
H. Timestamp
A timestamp is the current time of an event that a computer records. Through mechanisms, such as the Network Time Protocol, a computer maintains accurate current time, calibrated to minute fractions of a second. Such precision makes it possible for networked computers and applications to communicate effectively. The timestamp mechanism is used for a variety of synchronization purposes, such as assigning a sequence order for a multievent transaction so the transaction can be voided if a failure occurs. Another way that a timestamp is used is to record time in relation to a particular starting point in time. See Figure 13.
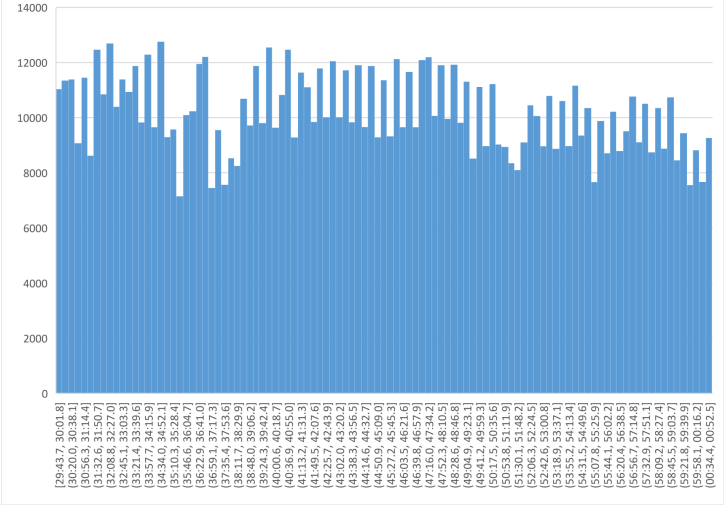
Figure. 13. Timestamp
For getting precious information, loco.gg the website is visited at different times of a day every day and packets are captured by Wireshark. As Figure 12. Shows, packets have the range of between 7000 bits and 13000 bits per minute. Maximum bits per minute is approximately 13000. It mostly changes between 12000 and 10000 bpm. This is a good indicator in the networking and displays that loco.gg can handle enough data per minute. Minimum bits per minute is about 7000. This means that the performance of the site rarely decreases.
COUNTRY MAP ANALYSIS
To visualize the geographic distribution of IP addresses in your network capture, you can use Wireshark's GeoIP mapping feature. The files contain a date stamp indicating the revision date of the file. Then, we need to set up a directory and extract key .mmdb files to this directory. Then a path in Wireshark preferences should be added. In Wireshark, select Edit | Preferences | Name Resolution. Finally, a trace file in Wireshark should be loaded. To see whether we have some City, Country, AS Number, and AS Organization information available, either the IPv4 or IPv6 tabs should be clicked. GeoIP mapping provides an approximation of IP address locations. Due to data limitations, the indicated city or country may not be the exact physical location of the device. This is especially true for mobile devices that frequently change networks. By following these steps, you can leverage Wireshark's GeoIP mapping feature to visualize the geographical distribution of IP addresses in your network captures, gain insights into network traffic patterns, and identify potential security threats. See Figure 14.
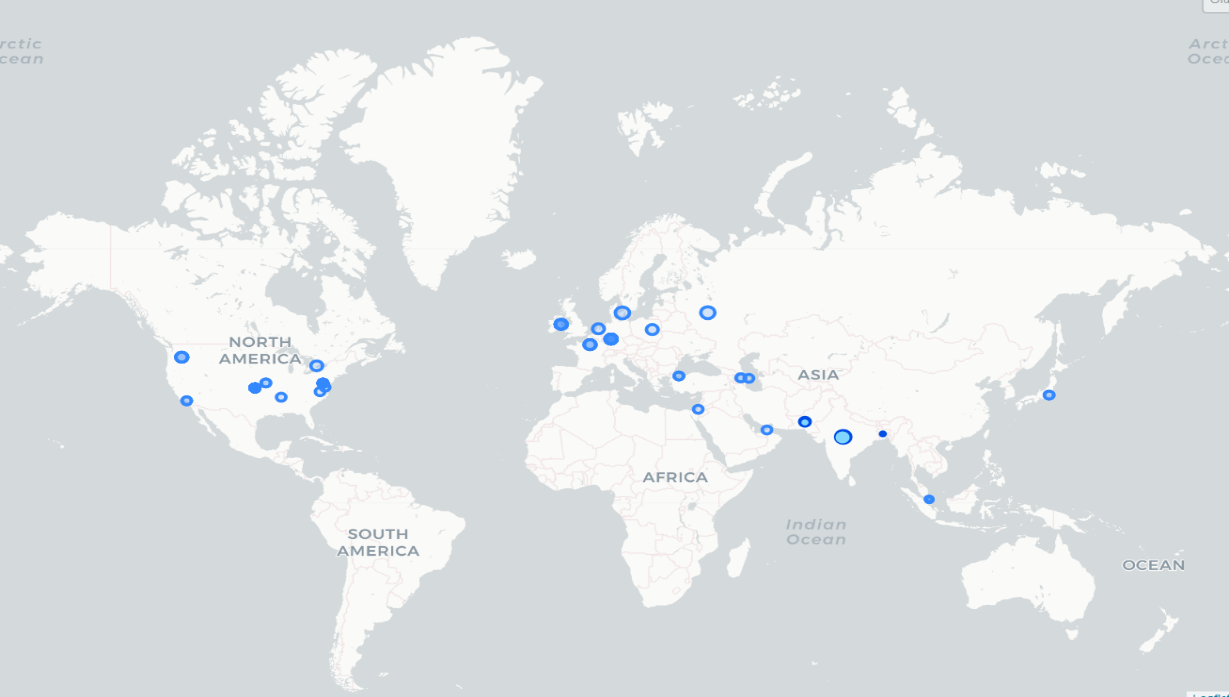
Figure. 14. Traffic Map
This map reveals the distribution of web traffic to loco.gg across various countries. This site is visited approximately 4.5 million times per month. The core audience is from India with 4M visits per month, accounting for nearly 90% of the total traffic. This highlights the immense reach and popularity of loco.gg within the Indian audience. Therefore, India was the top country sending traffic to loco.gg during the period we captured packets. Ranking second, Pakistan generates 205K visits monthly, representing 4.1% of the total traffic. Securing the third position, the USA contributes 137K monthly visits, translating to 1.5% of the total traffic. Bangladesh and the UAE follow these countries with high visits per month. Traffic was sent to loco.gg from some European countries, Turkiye, Azerbaijan, Israel, Russia, Malaysia and Japan during the period due to the map obtained by capturing packets, too.
CONCLUSION
In the intricate exploration of Loco.gg's network, the symbiotic interplay of data collection, filtering, and analysis has yielded invaluable insights into the platform's underlying dynamics. The journey commenced with the adept utilization of Wireshark, a powerful tool that served as the lens through which the intricate dance of network packets was observed. The meticulous data collection phase, spanning from 09.11.2023 to 03.12.2023, was marked by a comprehensive approach. Encompassing peak gaming hours and special events, this temporal map provided a rich landscape for investigating diverse scenarios influencing network traffic. Wireshark, configured not merely as an observer but as an active participant, captured a spectrum of packets alongside key metadata, forming the foundational elements for subsequent analysis. The subsequent data filtering process was a strategic endeavour, characterized by a judicious focus on critical components. Targeted traffic selection honed in on video streaming packets and chat interactions – pivotal elements reflecting the essence of Loco.gg's functionality. The temporal focus during filtering further illuminated the network's nuances, allowing for a granular examination of behaviours across distinct timeframes and user engagement scenarios.
The iterative refinement of filters addressed challenges, such as packet loss, ensuring that the resulting dataset maintained a high degree of precision. This dynamic process not only mitigated obstacles but also enhanced the reliability of the filtered dataset, forming the bedrock for nuanced analysis. Every filtering criterion was purposefully aligned with the overarching research questions. Whether deciphering peak gaming periods or dissecting the impact of specific protocols, each filter served as a deliberate instrument, extracting data that significantly contributed to answering core research inquiries.
In culmination, this holistic approach to network analysis provides a comprehensive understanding of Loco.gg's intricacies. The insights gleaned from the interplay of data collection, filtering, and analysis stand as a testament to the platform's robustness and offer a foundation for future investigations, contributing to the continual optimization of network performance on gaming platforms
REFERENCES
1. W. R. Stevens, “TCP/IP Illustrated, Volume 1: The Protocols, “Addison-Wesley, 2011
2. D. Comer, “Internetworking with TCP/IP: Principles, Protocols, and Architecture”, Prentice Hall, 2006
3. "How to Measure Bandwidth: Techniques for Precise Network Measurement", Internet: https://obkio.com/blog/how-to-measure-bandwidth/
4. N. Nagendra Kumar "Network Analysis Using Wireshark 2 Cookbook", Practical recipes to analyze and secure your network using Wireshark 2, 2nd edition, 2018.
5. Andrew Crouthamel "Mastering Wireshark 2", Develop skills for network analysis and address a wide range of information security threats 2018.
6. Lisa Bock "Learn Wireshark", Confidently navigate the Wireshark interface and solve real-world networking problems, 2019.
7. "I/O Graphs Window in Wireshark", Internet: https://www.geeksforgeeks.org/i-o-graphs-window-in-wireshark/
8. Official website of Loco, Internet: https://loco.gg/
9. Sensor tower, Internet: https://sensortower.com/
10. Medium, Internet: https://medium.com/
11. ”Flow Graph”, Internet: https://www.wireshark.org/docs/wsug_html_chunked/ChStatFlowGraph.html
12. Wireshark Network Analysis (Second Edition): The Official Wireshark Certified Network Analyst Study Guide by Laura Chappell
13. "Practical Packet Analysis: Using Wireshark to Solve Real-World Network Problems" by Chris Sanders
14. Throughput Analysis, Internet:https://www.superfastcpa.com/what-is-throughput-analysis/
15. Throughput, Internet:https://en.wikipedia.org/wiki/Network_throughput
16. Throughput Analysis with Wireshark, Internet: https://www.researchgate.net/figure/Wireshark-Throughput-Analysis-without-Applying-the-Resource-Allocation-in-Part-I-For-the_fig8_268391660
17. Timestamp, Internet: https://www.techtarget.com/whatis/definition/timestamp
18. GeoIp, Internet: https://www.chappell-university.com/post/geoip-mapping-in-wireshark
19. Ip addresses, Loco.gg, Internet: https://sites.ipaddress.com/loco.gg/#google_vignette
20. Loco.gg, Geograph, Internet: https://www.similarweb.com/website/loco.gg/#geograph
21. “Ip addresses analysis”, Internet: https://osqa-ask.wireshark.org/questions/20972/ip-addresses-analysis/
22. “measuring round trip time”, Internet: https://osqa-ask.wireshark.org/questions/4210/measuring-round-trip-time/
23. Wireshark’s official Website, Internet: https://www.wireshark.org/
24. IETF RFCsrelated to UDP, Internet: https://datatracker.ietf.org/doc/html/rfc768
25. QUIC Research Paper: https://www.researchgate.net/publication/353089470_The_Performance_and_Future_of_QUIC_Protocol_in_the_Modern_Internet
26. "Network Forensics: Tracking Hackers through Cyberspace" by Sherri Davidoff and Jonathan Ham
27. "Video Game Spaces: Image, Play, and Structure in 3D Worlds" by Michael Nitsche
28. "Wireshark Network Analysis: The Official Wireshark Certified Network Analyst Study Guide" by Laura Chappell
29. GeoIP, MaxMind, Internet: https://dev.maxmind.com/geoip
Written by Rana Mammadova